Fast Facts
A robot maintenance cost model that only accounts for scheduled service misses the largest expense category. Annual maintenance runs 5–15% of purchase price, but unplanned downtime can cost $125,000 per hour at median and reach $500,000 per hour at severity. After year seven, maintenance costs climb 30–50% as gearboxes, cables, and seals reach end-of-life. The procurement teams that build the full 10-year model before signing outperform those who discover the real number after installation.
A robot maintenance cost model built on vendor quotes alone is a model designed to fail. The purchase price of a $50,000 industrial arm represents as little as 11% of its true 10-year cost, according to Grabarobot’s 2026 TCO analysis. The rest—integration, maintenance, energy, consumables, downtime, and obsolescence—is invisible at the point of purchase but very real once the robot is running.
The question is not whether to budget for maintenance. Every procurement team knows they should. The question is whether the budget reflects what actually happens in years seven through ten, when the costs accelerate.
What the Annual Maintenance Number Actually Covers
Industry benchmarks converge on 5–15% of purchase price per year for industrial robot maintenance, according to RCC’s field analysis of more than 5,000 protected robots since 1998. For a €100,000 robot, that is €5,000 to €15,000 annually covering preventive service, spare parts, and occasional repair.
Collaborative robots carry lower absolute costs—roughly €1,500 to €4,000 per year—but handle lighter payloads and simpler tasks.
| Robot Type | Annual Maintenance (% of purchase price) |
|---|---|
| Cobot (3–10 kg) | 5–10% |
| Industrial 6-axis | 5–8% |
| High-speed delta | 8–12% |
| SCARA | 5–8% |
The A3 (Association for Advancing Automation) ROI framework uses 5% per year as its benchmark. AMD’s range is 3–8% depending on duty cycle and environment. A dirty, high-duty welding cell trends toward 8%; a clean, light-duty pick-and-place trends toward 3%.
Why the Model Breaks in Year Seven
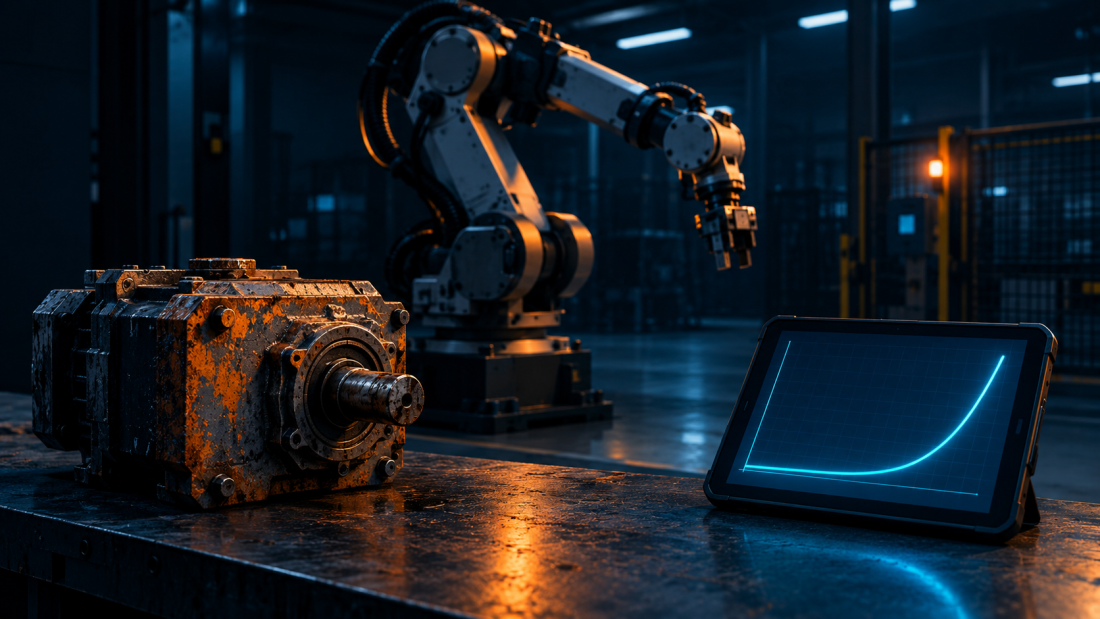
The annual percentage is not a fixed number. It is a curve that bends upward. Robots older than eight years typically see maintenance costs rise 30–50% compared to their early years, as gearboxes, cables, and seals reach end-of-life.
A new articulated robot purchased at €80,000 might cost €4,000–€6,000 annually in scheduled maintenance during its first five years. After year seven, that figure can climb past €10,000 as major components begin to fail.
Robot maintenance cost model built on a flat percentage misses this inflection. The model must account for component lifecycles, not just annual averages.
Operating environment accelerates the curve. Heat, dust, chemical exposure, and moisture wear every component from the controller to the cable harness. Usage intensity compounds it further: a robot running three shifts, six days a week is asking its components not to break three times as hard as a single-shift deployment.
The Downtime Number That Dominates the Model
Maintenance is the predictable expense. Downtime is the one that breaks budgets.
In ABB’s 2025 global survey-based downtime report, 83% of decision-makers estimated unplanned downtime costs at least $10,000 per hour, and 76% estimated it can reach up to $500,000 per hour depending on the operation and severity.
A separate manufacturing analysis put median downtime cost at $125,000 per hour, with unplanned stops cut 35–45% on integrated cells when predictive maintenance is deployed.
A single unplanned downtime event on a high-throughput line costs $260,000 per hour on average.
These numbers do not appear on a maintenance contract. They appear on the production P&L when the robot stops.
The robot maintenance cost model that procurement teams actually need combines two curves: the rising maintenance cost curve and the downtime cost curve. Preventive maintenance delivers 3–5x ROI compared to reactive, fix-when-broken approaches. That ROI comes from avoided downtime, not from cheaper parts.
⚠ Fiction—composite scenario, not a real event: A plant manager approves a robot purchase based on a vendor quote that includes a 5% annual maintenance estimate. The first three years track exactly to budget. In year four, a gearbox fails. The replacement part costs €8,000. The line is down for eleven hours while the part ships and the technician installs it. At €15,000 per hour in lost production, the downtime costs €165,000. The maintenance budget had €6,000 allocated for that year. The model was not wrong about the parts. It was wrong about the downtime.
Building the Ten-Year Model
Industrial Monitor Direct publishes a 10-year TCO formula that captures the full cost stack:
TCO_10yr = C_acquisition + C_install + C_training + C_spares + C_service + C_downtime + C_energy − C_residual
Each component has a real number behind it. Grabarobot’s five-year model for a $50,000 mid-size arm arrives at approximately $192,000 total cost of ownership—3.8x the hardware price—with maintenance and service alone at $25,000 over five years.
| Component | 5-Year Cost (Modeled) |
|---|---|
| Arm hardware | $50,000 |
| Integration & installation | $70,000 |
| Maintenance & service | $25,000 |
| Energy | $12,000 |
| Consumables & spares | $10,000 |
| Reprogramming & changeover | $15,000 |
| Software & licensing | $10,000 |
| Five-year TCO | ~$192,000 |
Extend that to ten years and account for the year-seven cost inflection, and the robot maintenance cost model reveals a number that looks nothing like the purchase order.
What Procurement Should Demand Before Signing
The model only works if the inputs are real. Three questions separate a defensible maintenance model from a vendor estimate:
| Question | Why It Matters |
|---|---|
| What is the component lifecycle schedule? | Gearbox, cable, and seal replacement intervals determine year-seven costs |
| What is the local spare parts availability? | Parts shipping from overseas extend downtime from hours to days |
| What is the service response time guarantee? | A 48-hour response time means 48 hours of downtime cost |
Vendor quotes that provide a single annual maintenance percentage without component lifecycle data are not maintenance models. They are placeholders.
Global Implications
For manufacturers in emerging markets, the robot maintenance cost model matters more than it does for buyers in mature markets. A facility in Nigeria or Southeast Asia may not have local spare parts inventory or same-day technician availability. A gearbox failure that costs a German plant €8,000 in parts and six hours of downtime may cost a Nigerian plant €8,000 in parts, €12,000 in expedited shipping, and three days of downtime.
The model must account for local service infrastructure, not global averages.
💡 CreedTec Analyst’s Note — Daniel Ikechukwu
Strategic Impact: The robot maintenance cost model is not an annual percentage. It is a ten-year curve with a sharp inflection after year seven and a downtime component that dwarfs the parts budget. Procurement teams that model only the annual percentage are budgeting for the easy years and discovering the expensive ones.
Stop: Accepting a single annual maintenance percentage as a complete cost model.
Start: Requiring component lifecycle schedules and local spare parts availability data as part of any robot procurement evaluation.
Watch: Whether vendors begin publishing ten-year TCO curves rather than annual percentages, which would signal the industry is responding to buyer demand for honest lifecycle data.
ROI Outlook: The payback period calculated on hardware cost alone is misleading. When the full ten-year robot maintenance cost model is included, payback extends by 12–24 months for most industrial deployments. Buyers who model this upfront avoid the budget shock that hits in year four.
Sources:
- RCC, “How Much Does Industrial Robot Maintenance Cost?”
- iFactory, “Manufacturing Robot ROI Calculator,”
- ABB, “Industrial Downtime Costs Up to $500,000 Per Hour,” 2025
- Industrial Monitor Direct, “Industrial Robot Vendor Evaluation: Selection and TCO Guide,” June 2026
Further Reading:
- The Industrial Robot Cost Guides Everyone’s Reading Assume You Pay US Wages
- Industrial Robots vs. Collaborative Robots: Cost, 5 Shocking Differences
- Teradyne Robotics Posts First-Ever $100M Quarter on AI Demand
- Maven Robotics Exits Stealth With $100M for Warehouse Bots
- HD Hyundai Robotics Tactile Sensor Investment: The $9.7M Bet on Robot Touch
Subscribe to CreedTec’s weekly briefing—robot maintenance economics, total cost of ownership models, and the procurement signals behind the hardware headlines.